recode-fa23
Debugging Web Pages on Mobile Devices
Part 1: Connecting to a local web page on mobile
Part 2a: Debugging on Safari (iOS)
Part 2b: Debugging on Android
You will need a USB cable to attach your mobile device to your desktop or laptop.
Overview
Debugging on mobile devices can be difficult because the small screen size and lack of traditional keyboard, among other things. So we usually tether our devices to a laptop or desktop via USB and watch the console there. Here’s how to set that up on both iOS and Android. I have tested this on iOS, but not on Android though, so please let me know ASAP if this is working or not for the latter.
Part 1: Connecting to a local web page on mobile
Before you deploy your site, you’ll need to visit it on your mobile device as you’re building it. To do so, you have to do a few things:
- Make sure your mobile device and computer are on the same wifi network.
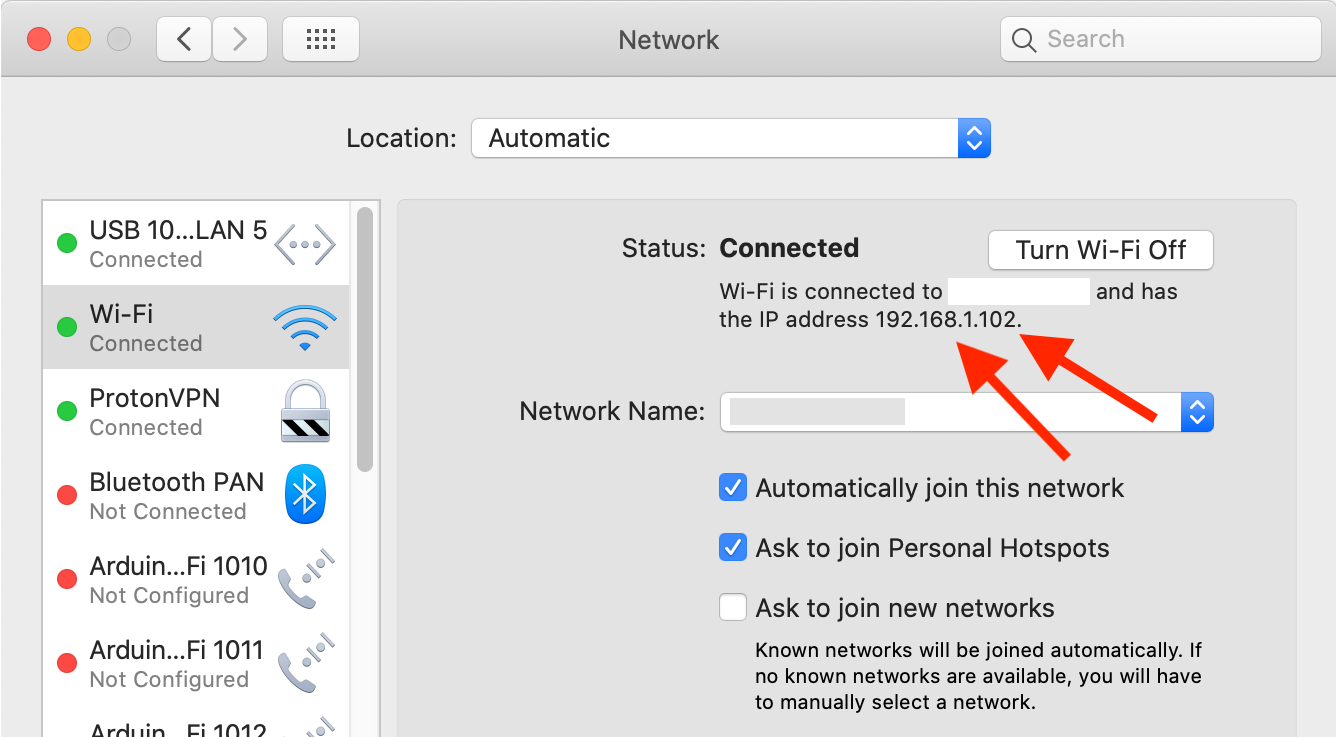
- Find the IP address of your computer (in MacOS, it’s in System Preferences > Network)
- Launch Live Server in VS Code or run nodemon in the folder you want to serve.
- Visit the IP address of your computer in your mobile device’s web browser, typically
http://192.168.1.XXX:<port>where<port>is the port number your site is being served on.
Here’s a demo video of the setup process in action.
Part 2a: Debugging on Safari (iOS)
Objective: Learn how to use Safari’s Web Inspector for debugging on iOS devices.
Steps:
- Connect iOS Device to Machine:
- Start by connecting your iOS device (iPhone or iPad) to your computer.
- Enable Web Inspector on iOS:
- Go to Settings > Safari.
- Scroll down to the bottom and open the Advanced menu.
- Turn on Web Inspector.
- Open Web Page for Debugging:
- On your iOS device, open the Safari browser and navigate to the web page you want to debug.
- Enable Develop Menu on Mac:
- Launch the Safari browser on your Mac.
- Click on Safari at the top > Preferences > Advanced.
- Check the option to Show Develop menu in the menu bar.
- Debugging:
- In the Safari menu bar, click on Develop.
- You’ll see your connected iOS device and the active URL on Safari.
- Click on the URL to open a new inspector window, where you can inspect, preview, or debug the page.
Reference: How to Activate the iPhone Debug Console or Web Inspector
Part 2b: Debugging on Chrome (Android)
Objective: Learn to remotely debug live content on Android devices using Chrome.
Steps:
- Prepare Android Device:
- Open the Developer Options screen on your Android and enable USB Debugging.
- Setup on Development Machine:
- Open Chrome and navigate to chrome://inspect#devices.
- Ensure Discover USB devices is enabled.
- Connect Android Device:
- Use a USB cable to connect your Android device to your development machine.
- If connecting for the first time, accept the debugging session prompt on your Android device.
- Debug Content:
- Open Chrome on your Android device.
- On your development machine, go to chrome://inspect/#devices.
- You will see your Android device’s model name and serial number.
- Click Inspect next to the URL you want to debug. A new DevTools instance will open for debugging.
- Inspecting Elements:
- In the DevTools instance, go to the Elements panel.
- Hover over an element to highlight it on your Android device.
- You can tap an element on your Android device to select it in the Elements panel of DevTools
References: Remote Debug Android Devices